


By: Elena Lopez1, Tomás Felgueiras1, Christian Grunert1, Frank Brückner1, Mirko Riede1, André Seidel1,2, Axel Marquardt2, Christoph Leyens1,2, Eckhard Beyer1,2
1 Fraunhofer Institute for Material and Beam Technology, Winterbergstraße 28, 01277 Dresden, Germany
2Dresden University of Technology, 01062 Dresden, Germany
Introduction
Qualification and certification of parts made by AM processes has been identified by various authors [1, 2, 3, 4, 5] as one of the main challenges for the widespread adoption of AM in fabrication of structurally critical components. Traditionally, the qualification of parts is made by extensive non-destructive and destructive tests in a representative sample amount of the final product. This is a slow and expensive process in any kind of production, but in AM processes, it also contradicts many of the identified advantages, i. e. potential to save material and therefore process costs. To solve this problem, the qualification of AM parts demands a different approach, with focus in the research of certification of AM parts based on design and correlations of parameters during manufacturing and non-destructive tests [1, 4, 5]. This is attained through standards that are emerging to control key process factors and ensure uniformity and consistency across multiple machines and manufacturers. These standards are quite recent and started being published in 2013, with new actualizations appearing every year, in an effort of ASTM and ISO organizations to keep up with the fast paced development of AM technologies [1, 4, 5]. However, indirect methods such as build planning and process monitoring need further development to be broadly applied as a certification tool, which, for the time being, leaves final part qualification as the only way to warrant quality.
Due to the unique capability of AM technologies of making parts with complex geometrical forms and internal features, it is necessary to employ inspection methods that are capable of assessing part quality as a whole. Therefore, non-contact methods are the most promising tools to analyze AM parts, X-ray computer tomography (CT) and 3D scanning being the most prominent ones.
Within this paper the use of computer tomography for quality control of final parts was explored, with the geometrical complex demonstrator developed by Fraunhofer IWS as a test part. First, CT was used to explore process limitations of electron beam melting (EBM) to produce geometrically accurate parts. Second, different demonstrators made by selective laser melting (SLM) with different materials were also compared in terms of geometrical accuracy and finally, comparison of the CT with 3D scanning measurements were carried out and analyzed for the different demonstrators.
Experimental: Inspection techniques
X-ray computer tomography (CT)
X-ray computer tomography (CT) uses electrically generated high intensity X-rays that pass through the investigated object from different angles as schematic represented in Figure 1. As X-rays pass through the object, they are attenuated due to absorption or scattering, generating different grey values. The total attenuation depends on the material composition, density and object thickness. The remaining X-ray fraction is registered by the detector generating hundreds or thousands of cross-sectional projections which are stacked together. Through mathematical algorithms, 3D voxels are created (3D pixel analog, with the associated grey value) which form the 3D reconstruction of the object.
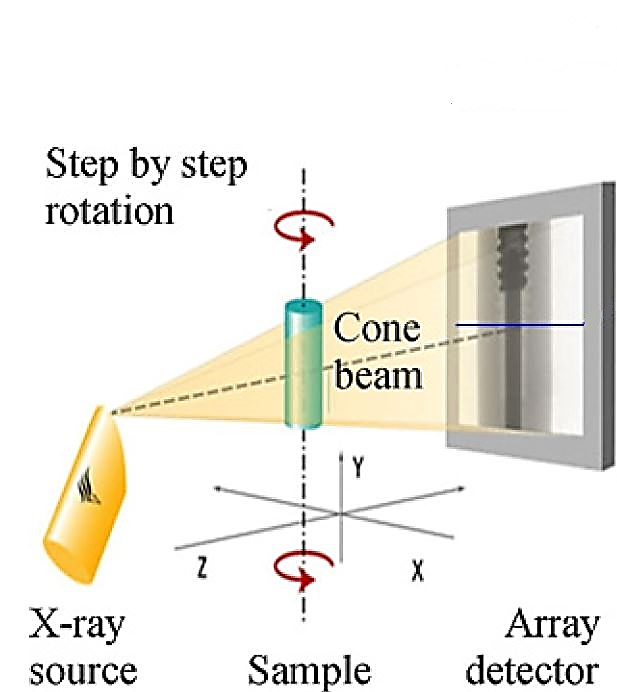
CT enables the scanning of all surfaces of an object, even if they are inside a part (e.g. cooling channels) because of the nature of X-ray. This results in a fully digitized object that allows a qualitative and quantitative characterization of the investigated object, giving exact information about the total part volume and wall thickness as well as porosities, cracks and inclusions [6].
The set-up used for the experimental work in this paper was a YXLON FF35 CT equipped with a 250 kV reflection X-ray vacuum tube with minimum spot size of ≤6 µm. In terms of detection, a 1792×2176 pixel YXLON flat panel 2530 detector was used.
3D Scanning
3D scanning uses structured light, i.e. a laser, that is projected on to the object which will distort the light direction depending on its shape. The light is captured by the camera and through triangulation the location of the measured point is calculated (see Figure 2). These points are afterwards processed by an algorithm and a 3D rendering of the object is made [7, 8].
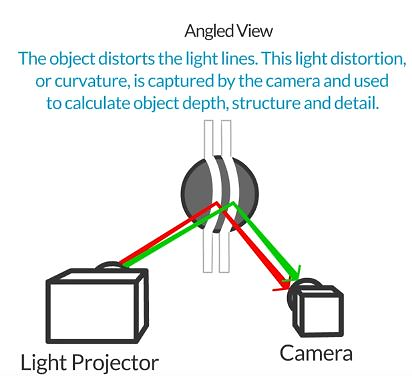
In the work presented in this paper, a GOM ATOS Core 45 was used (Figure 3) based in stereo fringe projection. In addition, it employs two cameras and a projector, that allows the capture of the object’s full surface geometry through a dense point cloud or polygon mesh[9].

Demonstrators
The use of demonstrators with defined complex geometrical features provide a proper way to evaluate the performance and benchmark of different AM techniques in order to determine process and geometrical accuracy, process repeatability and surface finish. The demonstrators in this paper are designed with challenging geometrical features with different sizes, like overhangs and thin wall structures. Different authors [10, 11, 12] proposed many different demonstrator designs, but some challenging geometrical features like internal channels have not been considered so far. The considered geometrical features at Fraunhofer IWS are detailed in Figure 4 and Figure 5 (see also Table 1). The demonstrator was also designed in a way that a scaling-up will ensure the comparison for Laser Metal Deposition.
Table 1 – Geometrical features extracted from the demonstrator and their quantification with suitable test methods.
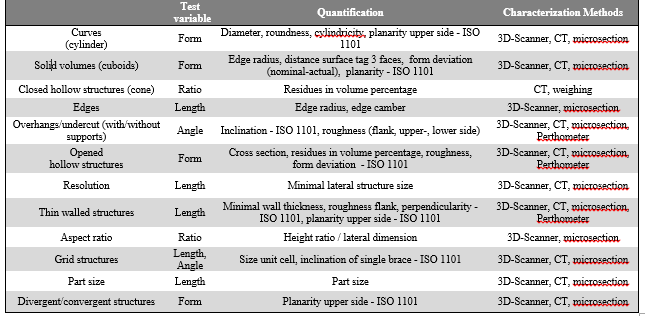
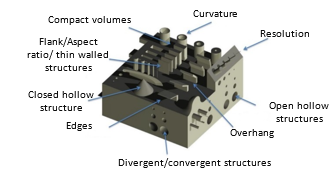
Figure 4 – Defined demonstrator to evaluate different challenging geometrical features (see description).
Experimental Results and Discussion
Demonstrator Analysis
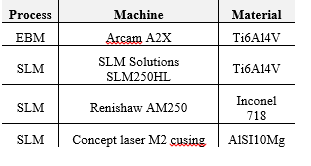
Several demonstrators made by different AM techniques were analyzed, as shown in Table 2. The analysis was made through X-ray computer tomography equipment YXLON FF35 CT, with the reconstruction software YXLON Reconspooler version 1.2.1.0 and the software VGStudio MAX 3.0 for the nominal/actual comparison and porosity analysis.
Table 2- Processes, machines and materials used for the building up of demonstrators.
EBM Demonstrators
On the analysis of the EBM parts, four demonstrators were considered. They were built with the same parameters (Table 3) but different support base square grid sizes as shown in Figure 5).
Table 3 – Build parameters of the EBM demonstrators.
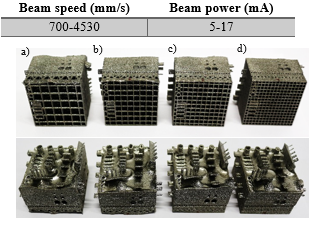
Figure 5 – EBM Ti6Al4V demonstrators with different square base sizes: a) 6x6mm square size; b) 5x5mm square size; c) 4x4mm square size; d) 3x3mm square size.
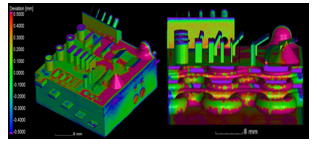
The EBM demonstrators did not accurately reproduce the features proposed originally, since they suffered from swelling on the Z direction, distorting the overall part (Figure 6). This defect indicates that high beam energies of 300 J/m and above were used [13]. Adding to the swelling in the Z direction the demonstrator also suffered from retraction around the part and the excessive building temperature led to sintering of powder inside the internal channels.
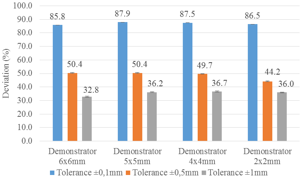
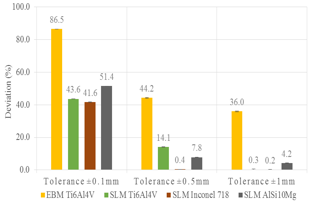
Comparison of deviation percentage of EBM demonstrators at different tolerance distances (Figure 7) revealed a positive effect of smaller square grid size, promoting higher heat transfer part/base, resulting in less distortion. However, even at ±1 mm deviation the demonstrators didn’t reach an ideal minimum threshold of 10% deviation. The 6x6mm demonstrator displayed the highest distortion visually, though displaying slightly best results at ±0.1 mm and ±1 mm tolerance (85.8 and 32.8%). This effect might be due to the automatic registration of the part made on VGstudio MAX which will tend to decrease the deviation between part and CAD file achieving a best fit.
SLM demonstrators
Three different materials have been chosen for the manufacturing of the SLM demonstrators (Ti6Al4V, Inconel 718 and AlSi10Mg). These materials have been selected due to their relevance for the manufacturing of parts for the aerospace, space and energy sectors. The influence of the material selection on the dimensional accuracy will be also analyzed and discussed in this paper (Figure 8).
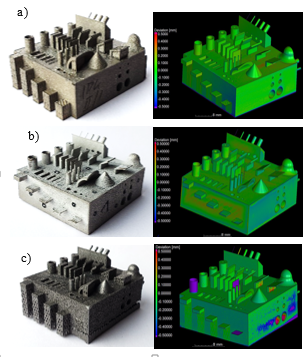
The analysis of the comparison for the SLM demonstrators pointed out that the material composition of the part affects the minimum feature possible, since the only appropriate demonstrator in order to reproduce all geometrical details was the one built up with Inconel 718, most probable because of the higher melting temperature of Inconel, allowing better metal melt pool control. The Ti6Al4V SLM demonstrator showed low deviation values even though it was not feasible to reproduce the columns with dimensions 0,1mm thin wall structures while also suffering from warpage and even detaching from the support structure (Figure 9).
Overall analysis on Figure 10 confirms the superior capability to reproduce fine details and better geometrical accuracy by SLM compared to EBM. However, the production of parts with tolerance inferior to ±0.5 mm appears to be the limit of SLM, being dependent on material choice for detailed feature reproduction.
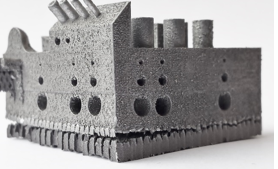
The porosity analysis of the SLM Ti6Al4V demonstrator has been carried out revealing a residual porosity of 0.018% (Figure 11). The cause of this porosity was an obstruction of the 0.5 mm internal channels with residual powder.

Comparison of Computer Tomography against 3D scanning
The use of the 3D scanning generated insufficient results (Figure 12) since a firm attachment mechanism to the base was needed to prevent movement of the part during the capture of the features from more angles, which otherwise would diminish the precision. This led the structures to create shadows and the high reflectivity of the metal part hindered the surface recognition. This generated a partial representation of the demonstrator, rendering it unfit for total comparison with the original CAD file.
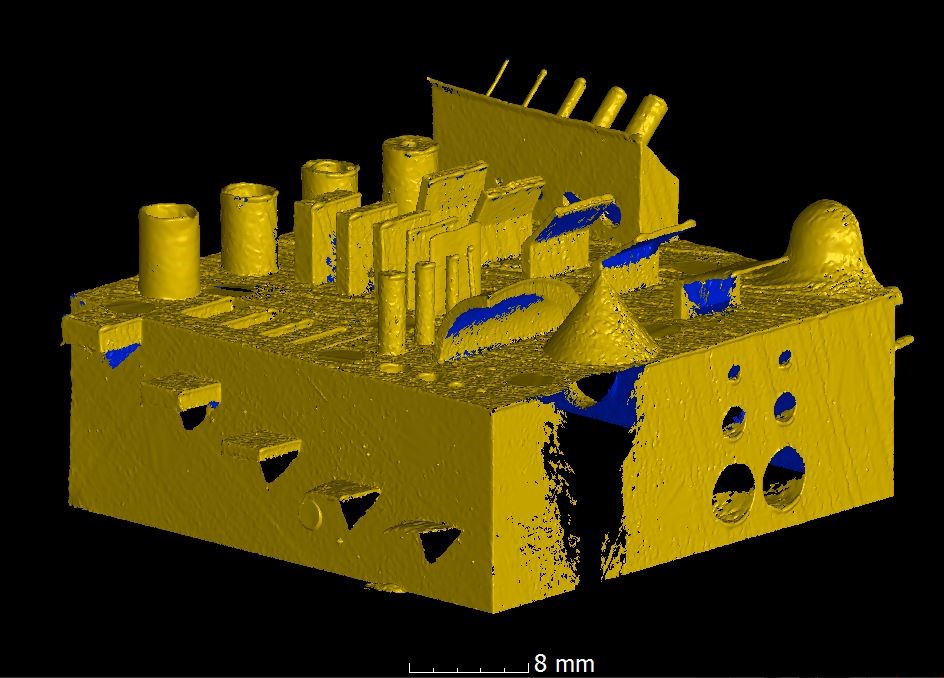
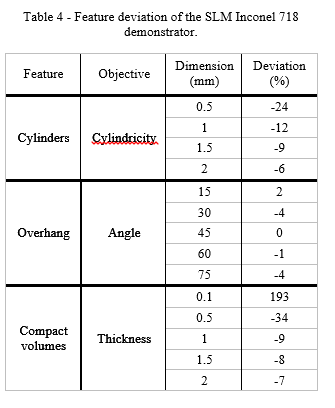
However, with the determined surface it was possible to make a analysis of the deviation of the features (Figure 13) using the software IMInspect 2015 IR4 by Innovmetric Software Inc. The results on Table 4 show higher deviations for lower dimension features, by which the machine was not capable of reproducing the 0.2 mm cylinder. These results corroborate the total comparison by computer tomography of minimum feature capability of features <0.5 mm.
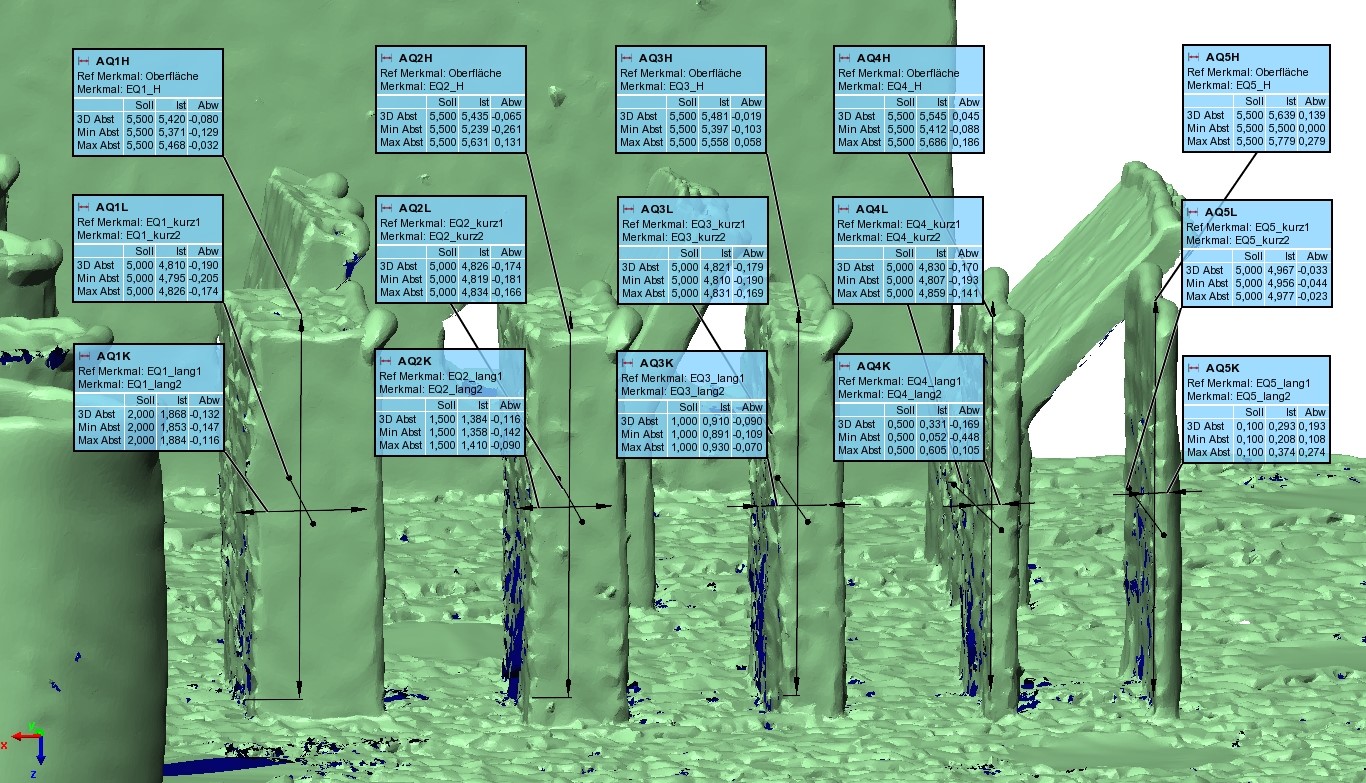
Table 4 – Feature deviation of the SLM Inconel 718 demonstrator.
On the other hand, the CT measurements were capable of fully characterizing the demonstrators, being able to display internal features, like the internal channels and the corresponding typical defects on overhang structures, that would be impossible to carry out by other methods.
Conclusions
Optical methods are insufficient for final part qualification due to their incapability to analyze internal features and the reflectivity of the surfaces of some parts that hinders accurate measurements. 3D scanning might be good for surface feature measurement, but it is insufficient for full characterization of an AM demonstrator of the addressed complexity aiming to explore the geometrical limits of additive manufacturing.
On the other hand, computer tomography can quantify all complex structures in scope of the proposed demonstrator and delivered deviation values of the measured structured, providing a good base for comparison across demonstrators made by different methods, materials and dimensions. Porosity or defects down to 3 µm can be determined by the used CT system.
The overall analysis confirmed the superior capability of SLM compared to EBM to reproduce fine details and better geometrical accuracy. However, the production of parts with tolerance inferior to ±0,5mm appears to be the limit of SLM, being dependent on material choice for detailed feature reproduction.
The subsequent comparison by means of computer tomography of the proposed demonstrators and the process conditions, allows one to deduce the most appropriate process parameters within a relatively small amount of experiments.
CT is the inspection and validation method of final parts that best fits the necessities of the AM industry. However, it is still a time-consuming procedure that requires several hours to set, run and analyze measurements and generate a report for each new part, which is not desired on an industrial environment. With the expected expansion of the AM market, CT machines development requires more focus on the necessities of the AM industry in order to shorten scanning and analysis time and turn CT measurements into an online quality control method of final parts in the manufacturing process.
References
[1]W. E. Frazier, “Metal additive manufacturing: A review,” J. Mater. Eng. Perform., vol. 23, no. 6, pp. 1917–1928, 2014.
[2]I. Gibson, D. Rosen, and B. Stucker, Additive Manufacturing Technologies. New York, NY: Springer New York, 2015.
[3]S. L. N. Ford, “Additive Manufacturing Technology : Potential Implications for U . S . Manufacturing Competitiveness,” J. Int. Commer. Econ., vol. 6, no. September, pp. 1–35, 2014.
[4]I. Wing, R. Groham, and B. Sniderman, “3D opportunity for quality assurance and parts qualification: Additive Manufacturing clears the bar,” Deloitte Univ. Press, 2015.
[5]Y. Huang, M. C. Leu, J. Mazumder, and A. Donmez, “Additive Manufacturing: Current State, Future Potential, Gaps and Needs, and Recommendations,” J. Manuf. Sci. Eng., vol. 137, no. 1, p. 14001, 2015.
[6]L. De Chiffre, S. Carmignato, J. P. Kruth, R. Schmitt, and A. Weckenmann, “Industrial applications of computed tomography,” CIRP Ann. – Manuf. Technol., vol. 63, no. 2, pp. 655–677, 2014.
[7]F. Chen, “Overview of three-dimensional shape measurement using optical methods,” 2017.
[8]C. Xiaobo, X. Jun, J. Tao, and J. Ye, “Research and development of an accurate 3D shape measurement system based on fringe projection : Model analysis and performance evaluation,” vol. 32, pp. 215–221, 2008.
[9]P. Kühmstedt, C. Munckelt, M. Heinze, and C. Bräuer-burchardt, “3D shape measurement with phase correlation based fringe projection,” Opt. Meas. Syst. Ind. Insp., vol. 6616, pp. 1–9, 2007.
[10]P. Shah, R. Racasan, and P. Bills, “Comparison of Different Additive Manufacturing Methods Using Optimized Computed Tomography,” 6th Conf. Ind. Comput. Tomogr., vol. 1, pp. 1–10, 2016.
[11]S. Moylan, J. Slotwinski, A. Cooke, K. Jurrens, and M. A. Donmez, “An Additive Manufacturing Test Artifact,” vol. 119, pp. 429–459, 2014.
[12]A. Thompson, I. Maskery, and R. K. Leach, “X-ray computed tomography for additive manufacturing: a review,” Meas. Sci. Technol., vol. 27, no. 7, p. 72001, 2016.
[13]A. Kirchner, B. Kloden, J. Luft, T. Weisgarber, and B. Kieback, “Process Window for Electron Beam Melting of Ti-6Al-4V,” Euro PM2014 – AMTechnologies, pp. 6–11, 2014.